

It’s no longer fun to be a Wall Street macro strategist.
On one hand you have to divine the future for risk assets, looking at corporate and economic fundamentals and data, and recommend “big picture” trades based on your assessment of corporate profits and interest rates which have traditionally been the two key drivers to any macro asset allocation decision.
On the other, none of that matters in a time of central planning when central banks have taken over price discovery, making your job meaningless as asset prices are now a direct consequence of nothing but central bank liquidity and explicit asset backstops.
As Deutsche Bank’s Stuart Sparks put it best, “These are administered markets and market outcomes will be dictated by the policy goals of the Fed and Treasury, and the tools they select to implement policy”
Not only is it not fun, there is a sense of dejected resignation (perhaps as market experts see their careers become obsolete), one which was especially palpable when reading the latest Flow Show report from BofA’s Chief Investment Strategist Michael Hartnett who writes that these are “fake markets” in which “government and corporate bond prices have been fixed by central banks…why would anyone expect stocks to price rationally?”
To be sure there is no rationality in a world in which over the past 8 weeks there has been a 38 million rise in US unemployment coupled with a $10 trillion forecast loss in global GDP in 2020/21; this however has been offset by $4 trillion of asset purchases by central banks resulting in a $15 trillion surge in global equity market cap.
The ample confusion plaguing market participants is laid bare as Hartnett lists the six most frequently asked questions Hartnett said investors have been asking since the lows including “who is going bust?”, “when will we retest the lows?”, and last but not least, “why is the stock market so divorced from reality?” Addressing the last question, Hartnett responds with the following list:
- Fake markets: government and corporate bond prices have been fixed by central banks…why would anyone expect stocks to price rationally?
- Context: 2215 out of 3042 global stocks remain in bear markets (20% below their alltime highs); $15tn stock rally must be placed in the context of $30tn collapse in Feb-Mar.
- History: bear market rallies in 1929, 1938, 1974 saw avg 61% rebound from lows (after avg 49% drop)…would take SPX to 3180 this rally.
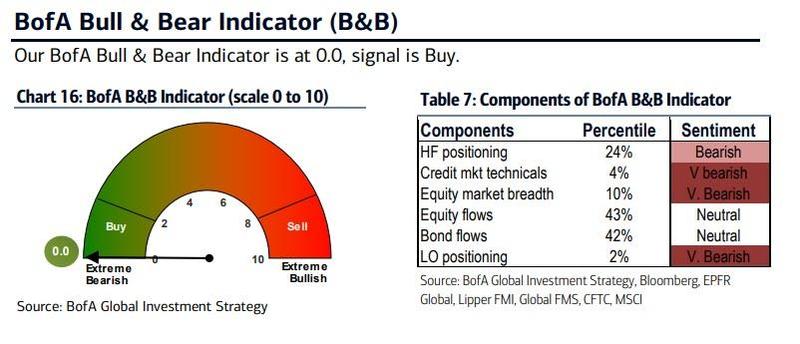
- Positioning: BofA May Global Fund Manager Survey…just 1/10 expect a V-shaped recovery vs. 8/10 expecting U or W-shaped recovery & 7/10 saying it’s a bear market; BofA Bull & Bear Indicator pinned at 0.0 (Chart 1), i.e. investors still very bearish.
- Policy: past 8 weeks central banks have been buying $2.4bn per hour of financial assets (this will fade to $608mn in coming weeks).
- Polarization: rally concentrated in “growth” and “yield” and “quality”…market cap of FAAMG stocks > Emerging Markets, MAGA stocks > Eurozone, US healthcare > global banks outside of the US (Table 1).
With these in mind, it is Hartnett’s job to provide his clients with a recommendation, and here too the schism between markets and the economy is visible, as the CIO is both bullish and bearish at the same time.
- Tactically bullish: still think positioning bearish and policy makers causing “immoral hazard”, forcing investors to buy, banks to lend, corporate zombies to issue in 2020; but clearly big technical levels immediately ahead (SPX 3000, NDX 10000, DXY100).
- Structurally bearish: EPS more likely to surprise to the downside in 2021 than 2020 as policy makers to demand payback via taxes, tariffs, regulation; possibility of negative US rates, pressure on bank dividends, election and peak globalization come into focus in autumn.
All that may be moot, however, in a market where capital flows – whether from the Fed or stimulus checks being used by retail investors to ramp up stocks – is all that matters. In this context, here are the Flows to Know according to Hartnett:
- # Cash mountain has peaked: in the past 8 weeks we have seen $1.0tn into cash, this week saw first outflows since Feb 19th ($5.9bn).
- # Leaders: Monday saw 5th largest single day inflow to tech since 2011 ($1.2bn, largest since Jul’19), $16.7bn into healthcare past 8 weeks.
- # Laggards: better love for small caps, no love for EM…largest inflow to US small cap stocks ($1.9bn) since Dec’19 this week, $3.8bn out of EM debt + equities.
If that wasn’t enough confusion, here are some other notable features of the ongoing bear market rally starting with the persistent bearishness of most “smart money” investors who have been dumping stocks for 6 consecutive weeks, dumping to retail investors who have been bidding up stocks with near total abandon:
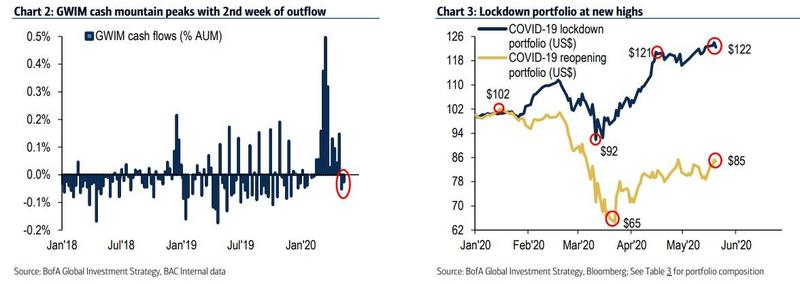
- BofA private clients: GWIM confirms cash mountain peak with 2nd week of outflow (Chart 2) and rotation back into bonds (largest inflow to debt since Mar’19 into IG, MBS, HY, Treasuries); sellers out of stocks 6 out of past 6 weeks.
- BofA private client AA: latest is 56.6% in stocks, 23.2% in bonds, 13.9% in cash.
- Yield curve: Aug’19 inversion of yield curve was lead indicator of recession; yield curve now steepening 5-30s >100bps (steepest since 2017); but BofA reopening portfolio still slightly underperforming lockdown portfolio (Chart 3 & Table 3).
- US consumer vs Asian producer: US mortgage applications to purchase homes back to pre-COVID levels (Chart 4); US unemployment claims down, BAC credit card data improving; Korea May 20-day exports -20% YoY…v coincident with global EPS growth (Chart 5); but if US consumer improves investors should be long EM this summer as catch-up play
Alex Jones covers what is on the horizon with COVID-19, the lockdown, the vaccine, and how Big Tech wants to run your life.
The Emergency Election Sale is now live! Get 30% to 60% off our most popular products today!